Your phone beeps, and it’s your favorite sports app letting you know your local team has a game tonight and who’s injured. You decide to check the weather in case you want to go. In both cases, your phone has captured and shared location observation information. Every time you download an app and it asks you if you would like to share location information for local updates, you are agreeing to share location observations with data providers.
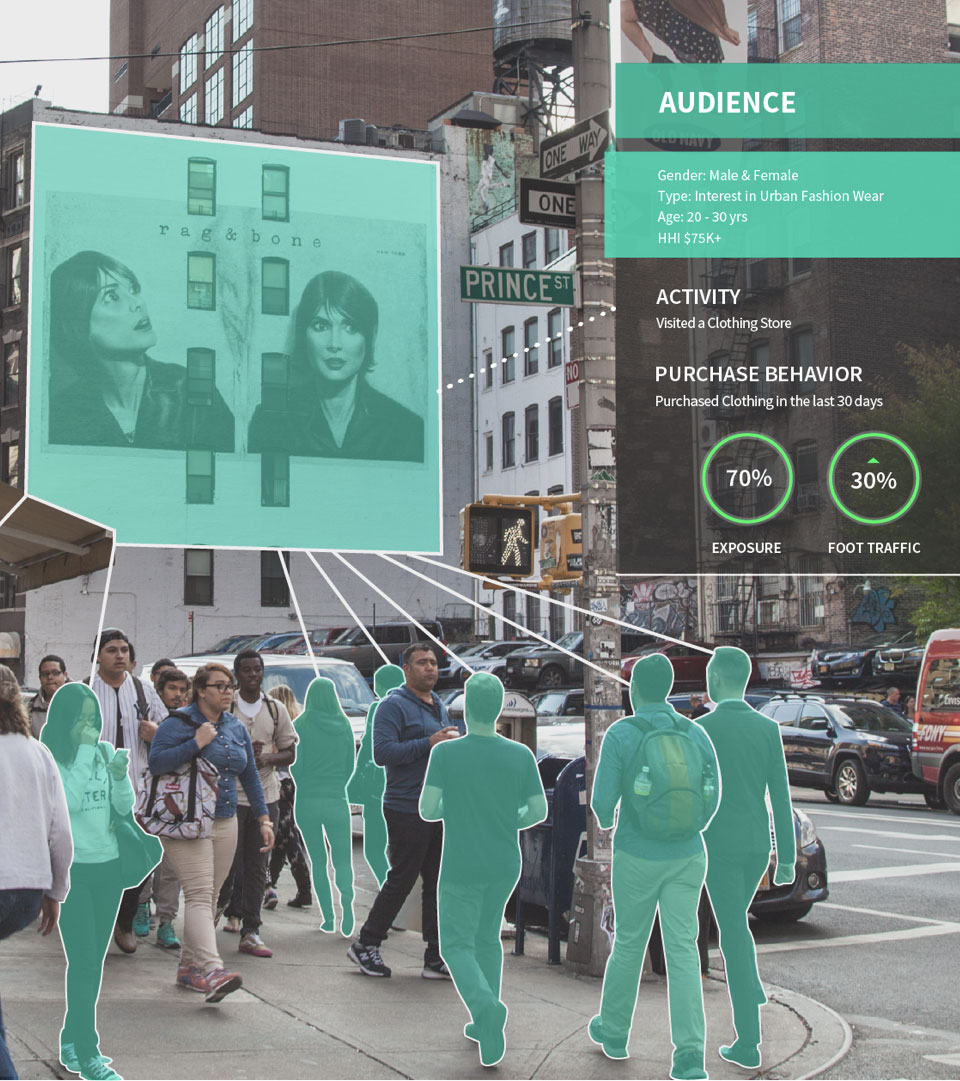
Location observation data can be leveraged by advertisers to anonymously determine the traffic patterns for audiences in the physical world and their visitation to specific locations. You can also determine how many devices are exposed to ads or visit retail locations based on the demographic and behavioral profile for that audience.
Everyday location and other contextual data is leveraged anonymously by brands to effectively target their marketing campaigns and understand how consumers are responding to ads across channels. For brands across all industries, mapping the consumer journey and personalizing the experience, both online and in the physical world, has become increasingly important.
While in the past, the ability to segment and target specific audiences was limited primarily to digital, OOH media is now opening new opportunities for brands to connect with target customers with even more precision.
By applying machine learning models to location data, brands now have the ability to look at what specific locations and properties in the physical world deliver the greatest ROI and are likely to reach their target audience. Even further, they can directly correlate OOH ads to real world outcomes such as driving retail foot traffic, in-store purchases, app downloads and sales.

For marketers investing in OOH, it’s important to know how the data can be dissected in order to make better decisions. Here are 5 ways brands can leverage OOH attribution and insights to improve ROI for their broader marketing campaign:
1. Create testing parameters
Like any model for reporting, knowing what you are trying to analyze before the test begins helps to qualify results. Out-of-home (OOH) attribution is very similar in the way you want to define the type of media, strategic location, or audience targeting you’re comparing.
For example, you can test what percentage of static vs. digital OOH ads deliver the best response with consumers, or how Firefly’s ride-sharing taxi tops compare to wallscapes. Similarly, you can create testing parameters to compare whether maximizing foot traffic (including proximity to retail locations) or visibility during drive time generates stronger results.
In addition to demographic and behavioral data, advertisers can now pinpoint the OOH placements that best reach their target customers along their daily commute. This helps brands test new products in different neighborhoods and environments, measuring audience success against in-store visitation and sales.
2. Understand how and where your audience travels
Brands and agencies can use attribution reporting to anonymously determine the traffic patterns for audiences in the physical world and their visitation to specific locations. You can also determine how many devices are exposed to ads or visit retail locations.
Similarly, we define the parameters of a building, retailer, restaurant, hotel, or any point of interest that we’d like our digital net to capture locations observations for, in order to measure visitation after exposure. Understanding where devices travel, how frequently they visit locations, if they’re exposed to our ad campaign, then visiting specific points of interest, is the roadmap for producing attribution reports.
3. How Much Is Enough?
Although 90% of all devices in the US provide location observation data, not every device is giving off location observation data at every moment and in every environment. Because of this, attribution reporting only reflects a fraction of the total population in any given environment. In other words, if 100 people show up to a restaurant at lunch, between noon and 1 PM, an average of 20% of those customers or 20 devices will provide substantial location observation information. In most cases, this amount of data can be validated as an accurate representation of the market, in terms of profile, demographic, and behavioral information.
Best practice for aiming to have enough observation data to be a fair representation of the market, you want the reach of your OOHmedia to exceed 20% of the overall market population. It’s important that the total market reach exceed 20% of the market population.
4. Cross Channel Audiences
Mobile IDs provide a unique identifier to anonymously match audiences in the physical world across media channels and marketing platforms. These mobile IDs can be matched to data providers or marketing platforms of other media channels. They can also be converted into IP Addresses and matched to audiences visiting websites or converting online.
By applying their own panel of data, OOH ad-tech companies are able to match audience IDs across channels. This helps increase transparency, accuracy and volume when matching OOH audiences to your online audiences using a pixel, or your customer database, using a DMP.
5. Keep, Cut & Add Look-Alikes
Utilizing attribution reporting allows brands and advertisers to understand audience exposure, store visitation, online visitation, and which ad placement has the highest exposure to audiences that converted. Similar to other media formats, the goals it to optimize your campaign by keeping strong performing placements, cutting poor performing placements and adding placements that have indicated an opportunity for success.
With OOH media, we have the ability to identify which placements reached the most amount of converted audiences, which reached the least and we can identify which placements that were not a part of our campaign that performed the best.
Essentially, indicating how we can improve our campaign to reach more audiences with a higher likelihood of conversion. This can take place after three months, six months or daily with digital OOH.
Identifying what you are solving for, understanding where your data is coming from and who it represents, then knowing how to make decisions with media will allow you to greatly improve your OOH media performance.


Great piece! OOH data can be used in so many ways, and learning a few new attribution ideas is always welcome. Thanks for a great piece.